


At LinkedIn, we have a unique view into how 300 million professionals are moving around the world to pursue career opportunities. This mobility of professional talent can tell us a great deal about the state of economic opportunity and the health of the global economy. So we’re seeking to better understand and map the dynamics of economic indicators as we continue to build the Economic Graph.
To get a big picture view of talent mobility, we analyzed our data to see which countries gained and lost the most talent between November 2012 and November 2013, and what characteristics are shared by those who relocate for their careers.
Members Are Moving, But Certain Countries Gain More Talent
We measured net inflow and outflow of LinkedIn members for 20 countries where we saw the most migration activity to see which were the overall winners and losers of talent in 2013.
As a percentage of the total country workforce, The United Arab Emirates (UAE) saw the most talent coming into the country with the majority of members coming from India. Spain, which has been facing tough economic conditions, saw the most talent leaving the country, with the majority of members leaving for the United Kingdom.
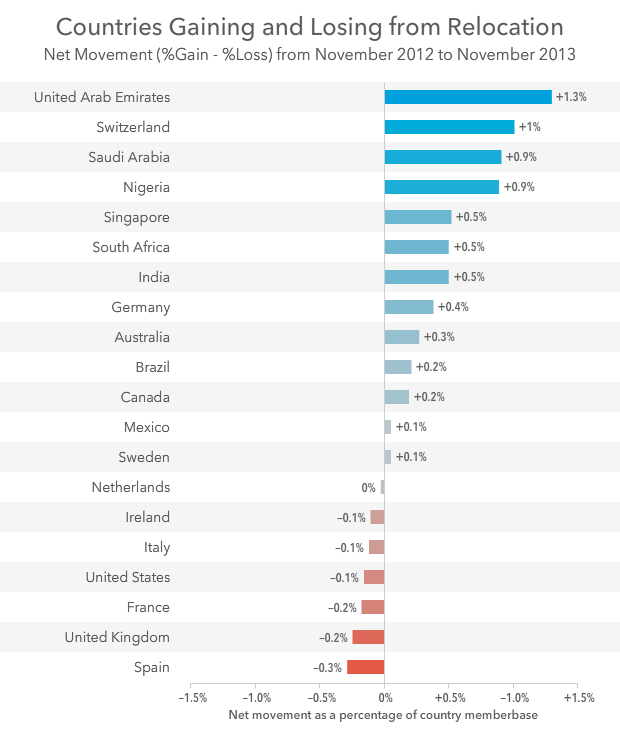
Countries in blue gained more members than they lost. Countries in red lost more members than they gained.
A few highlights stood out to us after digging deeper into specific country data:
- UAE saw a strong inflow of professionals at 1.3% net gain particularly among architecture and engineering roles. This might reflect the region’s fast development and the increasingly busy skyline. We noticed that the vast majority of members who moved to the UAE (75%) came from outside of the Middle East. Additionally, we saw that many members were promoted as part of their move, with 40% of members indicating a seniority of “manager” or higher in the title of their new position.
- Spain has the largest net loss of 0.3%, most likely as a result of the economic challenges in recent years. Proximity to their home country appears to be an important driving factor with 60% of professionals who left Spain remaining within Europe. However, Spanish-speaking countries in Latin America are also a popular destination for Spanish professionals representing about 20% of those who moved.
- Germany has achieved a net gain of 0.4% showing it is one of Europe’s strongest and most resilient economies. Our analysis indicates that over 60% of members moving to Germany in the past year came from another European country. Germany has attracted a strong inflow of technical talent from around Europe. The majority of them are in engineering and research functions, working in the automotive and software industries.
- 1 out of 3 LinkedIn members who made a move of 100 miles or more in the last year relocated internationally. This varied drastically due to country size and proximity to neighboring economic centers. For example, Switzerland, a small landlocked country, saw the greatest percentage of movers leave the country at 69%. The top destinations for Swiss movers were Germany and France. Compare this to the United States, a country of much greater size and a particularly insular culture (The US Secretary of Education Arne Duncan pointed out in 2010, only 18% of Americans claim to know another language), where only 3% of movers left the country in the past year.
Career Traits That Require A Suitcase
Most people would find it easy to conjure up the image of what an international business professional looks like, but what are the common traits among people who are more likely to work internationally? To find out, we looked at a number of characteristics that were most likely to be found among our sample set of movers vs. non-movers.
The first thing we noticed was that it appears younger professionals are more likely to work internationally. Members who made a significant move in the past year had an average of 7.8 years of professional experience, but those who made shorter moves had 20% more professional experience compared to the significant movers.
When we looked at the specific skills listed in the profiles of members who moved, we noticed some skills were twice as likely to be found on the profile of a mover’s compared to a non-mover’s. Below are the top 10 skill categories that were most unique to movers in the past year:
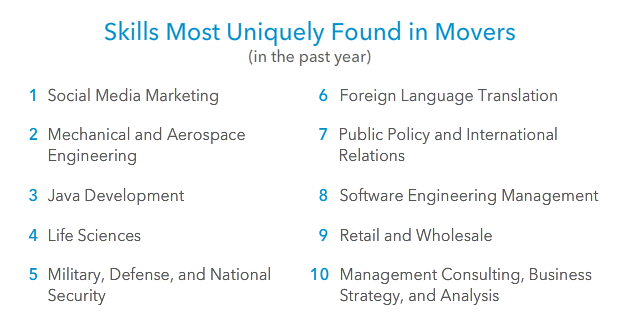
Skills in Science, Technology, Engineering, and Math (STEM) made up nearly half the list (4 out of 10). We also noticed that members who moved in the past year that had STEM skills also tended to travel the furthest distances for their new role, averaging nearly 2,400 miles (3,900 km). So if you’re looking for a career that will allow you to see various cities around the world, you might want to focus your studies in a STEM discipline.
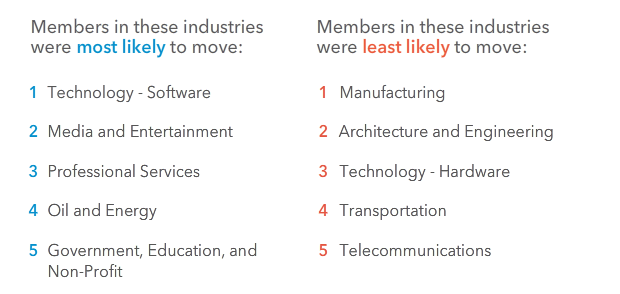
We also looked at the most represented industries by members who moved versus those that didn’t, and found a fairly distinct separation.
Finally, we looked at all of the types of work members did, and compared these various functions found within businesses by their likelihood of having members who moved in the past year.
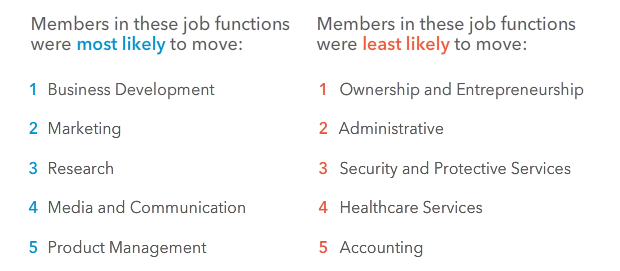
So, what can we conclude from this? Well, if you want to work all over the world, you might have a strong set of STEM skills, be a social media marketing expert, and/ or aim for business development role in a technology company with offices in the UAE.
In the coming weeks and months we will continue to explore the topic of talent migration, with a focus on areas such as recent graduates, and publish the research here on the LinkedIn blog.
With our feet back on the ground, we’re going to continue looking at these and related themes as we build the Economic Graph, digitally mapping the global economy. It’s our hope that in the near future this information will help all of our members make important life decisions (including whether or not they should make the big move) that puts them on a path to pursuing economic opportunity.
Methodological details: The results of this analysis represent the world as seen through the lens of LinkedIn data. As such, it is influenced by how members chose to use the site, which can vary based on professional, social, and regional culture, as well as overall site availability and accessibility. These variances were not accounted for in the analysis. Additionally, nationality and visa status are not fields included in the LinkedIn profile. Therefore, we cannot make any inferences on the citizenship of our members who were included in this analysis.
Only countries with more than 3,000 members who made a move between November 2012 and November 2013 were included in our ranking. China was specifically excluded from our analysis as our official entry into the country was announced after the time window of our analysis. At the time of the analysis, LinkedIn was only available in English, resulting in multinational corporations being over-represented among members in China, which presented a significant artificial skew in our analysis.
We determined the geographic movements of our members in the last year by looking at every new position that was added to profiles between November 2012 and November 2013, which included a regionally specific location (e.g. “Greater Los Angeles Area”) that differed from the regionally specific location of the previously held position (e.g. “Greater New York City Area”). Next, we excluded movements that did not exceed 100 miles (161 km), based on the direct distance between two geographic coordinates, generalized as the geographic center of each region.
To determine most unique skill categories among movers, we first grouped individual skills into meaningful categories. Then we isolated the skill categories that were most likely to be found among our sample set of movers and not in our sample set of non-movers. To determine the industries most likely to move, we grouped members into industries based on the company they work for, and compared industry groups by the percentage of members that moved in the past year. Finally, to determine which business functions were most likely to move, we categorized members into functions by classifying their titles into functional groups, and compared functions by the percentage of members that moved in the past year.